Getting Started — From Login to Your First Result
This guide walks you through your first session in MangoGridStudio. By the end, you will have built a power system model, run a generator scheduling optimization, and reviewed the results. No programming or optimization experience required.
What You Will Learn
- How to log in and navigate the main interface
- How to create a new project and import network data
- How to configure generators and set up a scheduling run
- How to launch the optimizer and monitor its progress
- How to view your first set of results
Step 1: Log In
Open your browser and navigate to the MangoGridStudio URL your administrator provided. Enter your email address and password, then click Sign In.
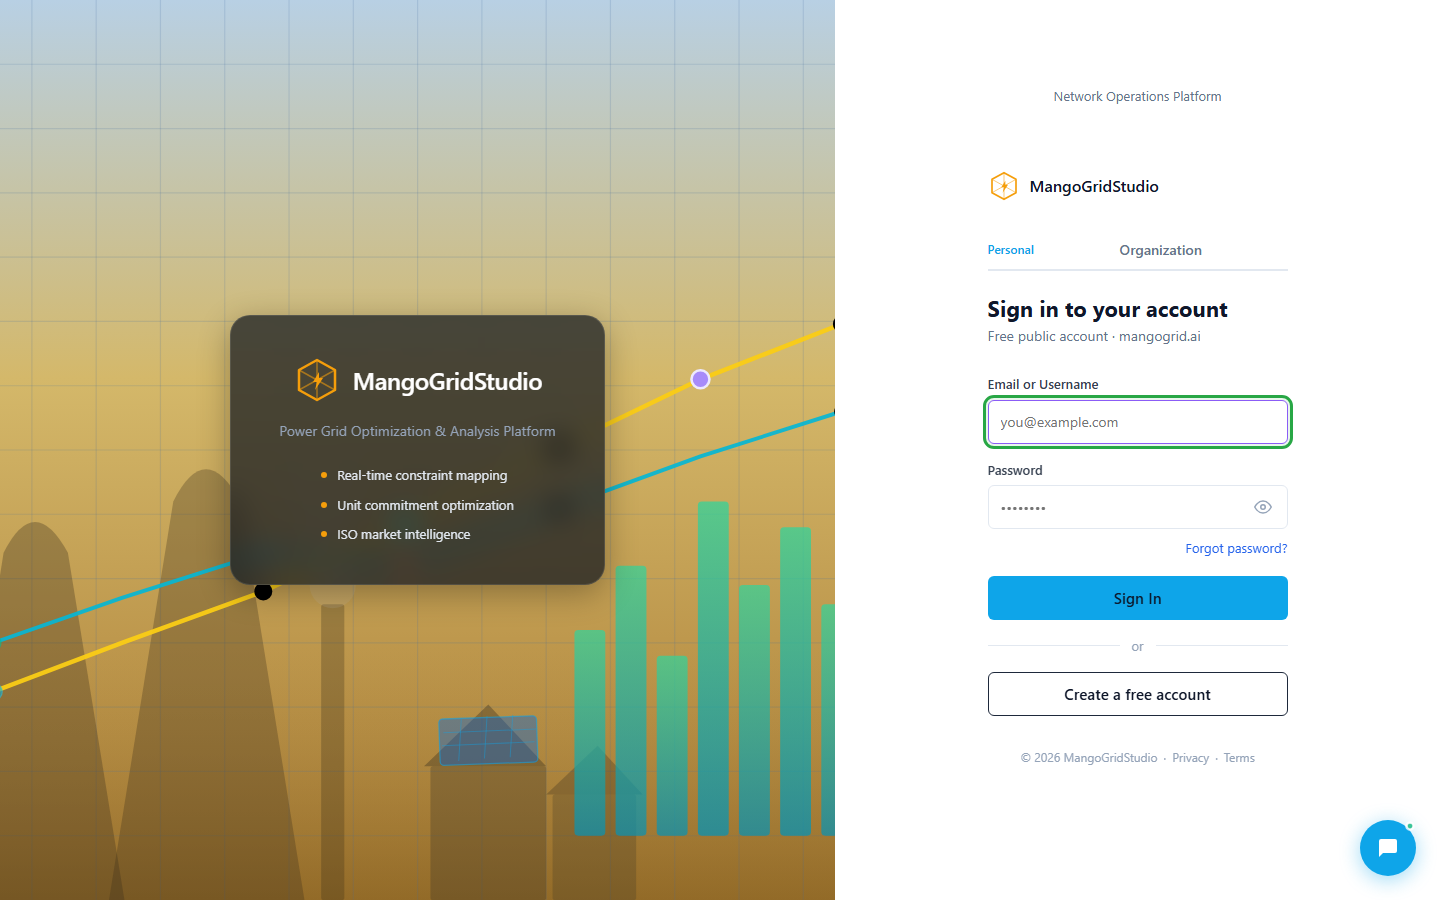
Tip: If you do not have an account, ask your team administrator to create one for you. MangoGridStudio uses role-based access — your administrator assigns permissions based on your job function.
Step 2: Create a New Project
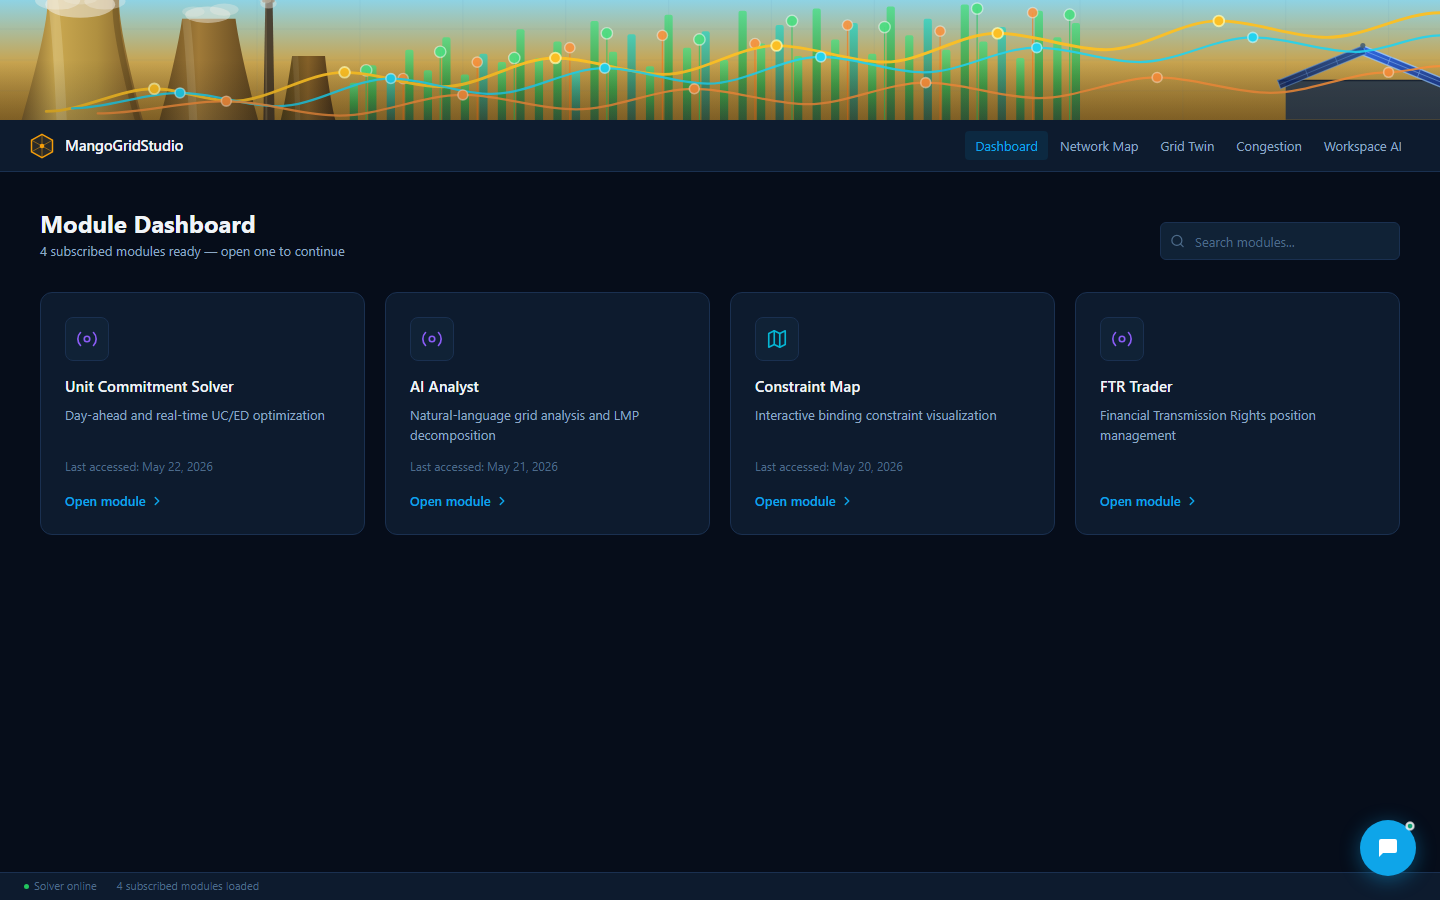
After logging in, you land on the Home page. This is your command center — it shows your recent projects, quick actions, and any active optimization runs.
Click New Project. Give your project a descriptive name (for example, "Summer Peak Analysis 2026") and an optional description. Click Create.
Step 3: Import Your Network Data
Every optimization needs a power system to work with. MangoGridStudio accepts network data in several formats: JSON, CSV, or Excel spreadsheets.
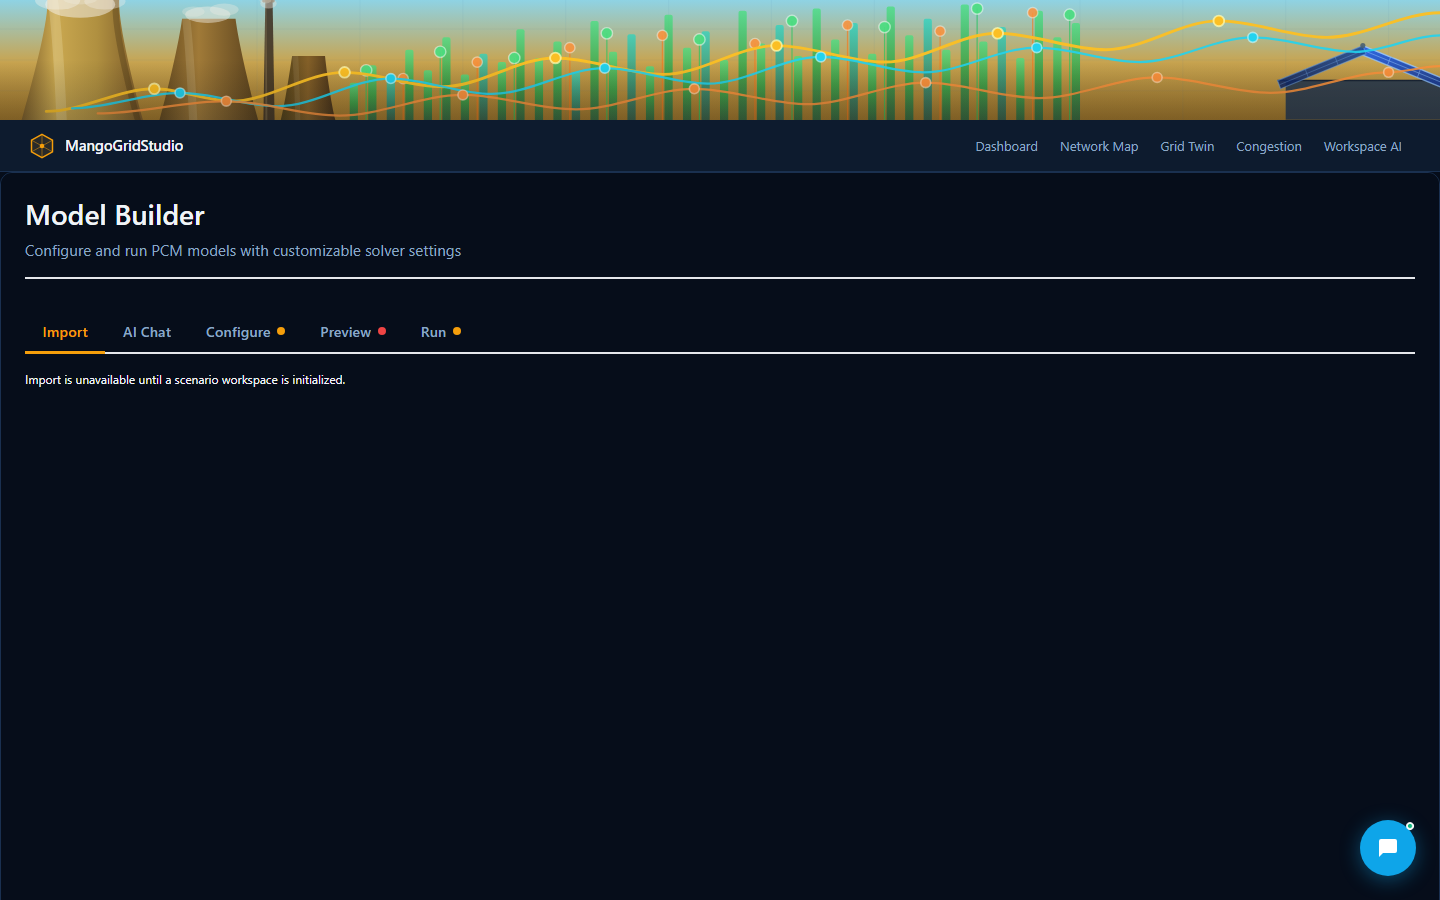
- In your new project, click Import Data in the left sidebar.
- Choose your data source: upload a file from your computer, or select from available sample networks.
- If this is your first time, select the IEEE 118-Bus Sample Network — a realistic 118-bus system with 54 generators and 186 transmission lines. This lets you explore the platform without needing your own data.
- Click Import. MangoGridStudio validates the data and shows a summary: number of generators, buses, and transmission lines.
Tip: If you see validation warnings (yellow), the import will still proceed, but some data may need correction. If you see validation errors (red), the import cannot continue until the issues are fixed. Click any warning or error message to see exactly which field needs attention.
Step 4: Review Your Network
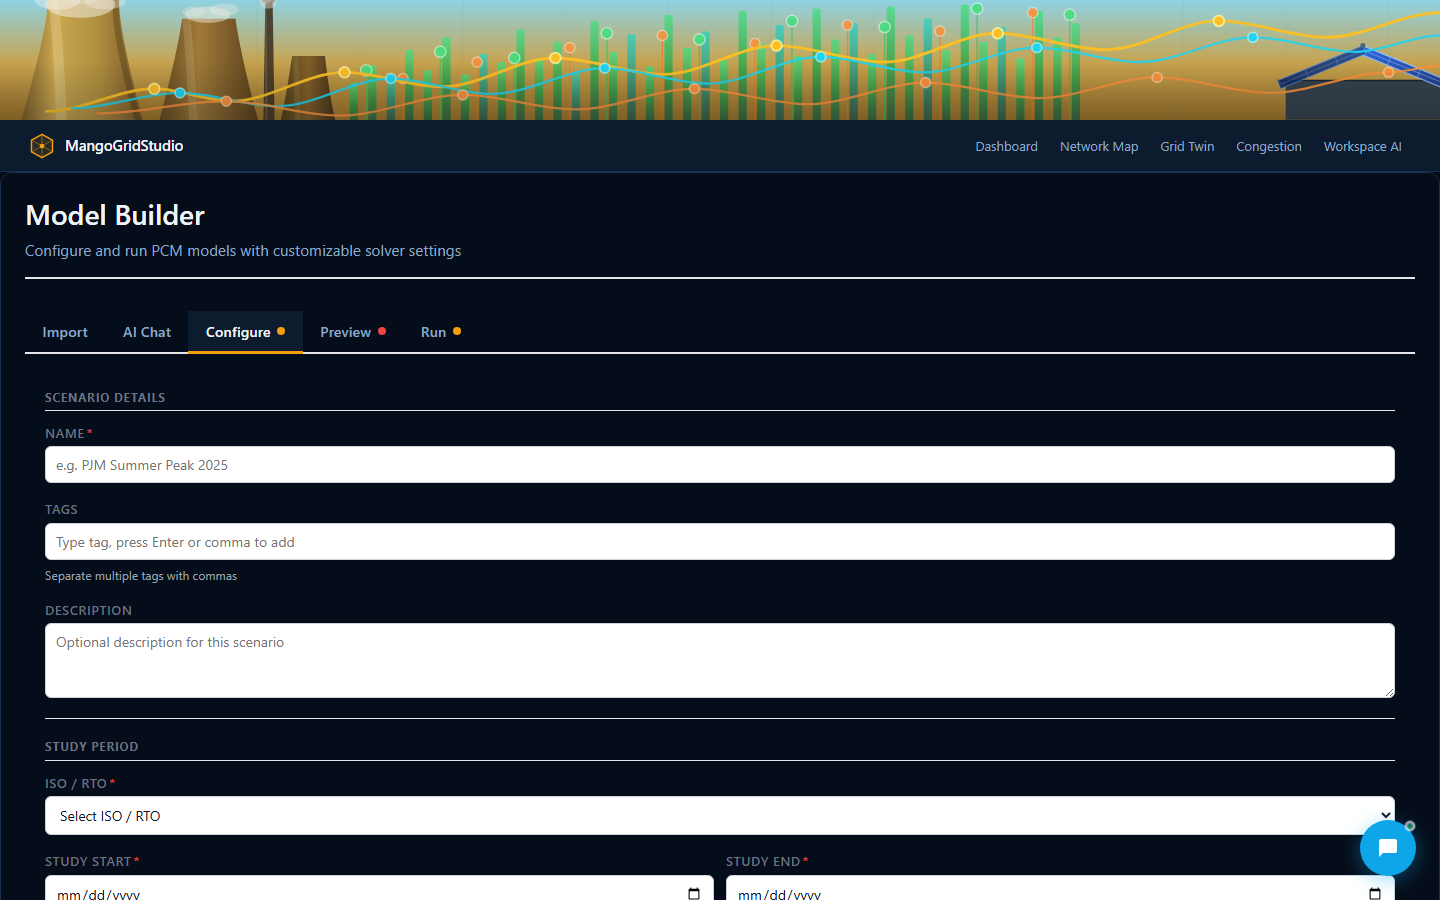
After importing, the Model Builder opens. This is where you see and configure your power system.
- Generators tab: Lists every generator with its capacity (how much power it can produce), fuel type, operating costs, and physical limits (minimum output, ramp rates, startup times).
- Network tab: Shows buses (connection points) and transmission lines with their capacity ratings.
- Load tab: Displays the electricity demand forecast for each hour of the study period.
Scan the generator list to make sure the data looks reasonable. You do not need to change anything for your first run.
Step 5: Configure and Launch
- Click Run in the top toolbar.
- The Run Configuration panel opens. For your first run, the defaults work well:
- Study type: Day-Ahead Scheduling (determines which generators run each hour over a 24-hour period)
- Horizon: 24 hours
- Solver: HiGHS (the default open-source solver — no license required)
- Click Start Optimization.
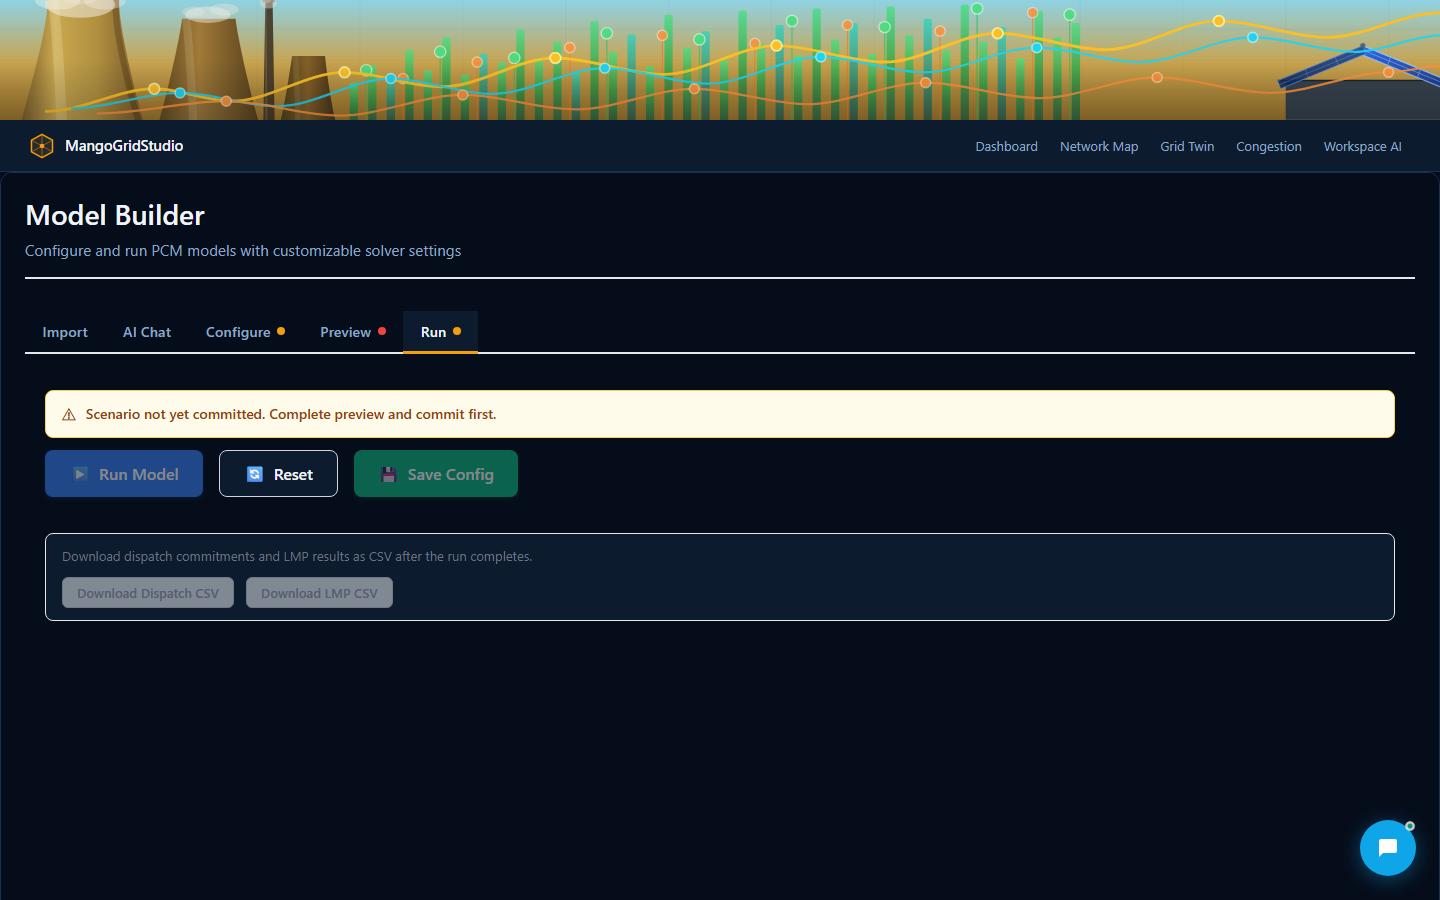
The optimizer begins working. A progress indicator shows the current status: building the model, solving, and running quality checks.
Tip: A typical 118-bus network solves in under 30 seconds. Larger systems may take a few minutes. You can continue working while the optimizer runs — results will appear automatically when it finishes.
Step 6: Review Your Results
When the optimization completes, the Results Dashboard opens. You will see four main views:
-
Dispatch Stack Chart: A colored area chart showing which generators are producing power each hour, stacked by fuel type. This is the "big picture" — it tells you the generation mix at a glance.
-
Health Score: A number from 0 to 100 grading the overall quality of the solution. A score above 90 (grade A) means the model is well-calibrated. Below 70 (grade C or lower) means something may need attention.
-
Commitment Timeline: A horizontal bar chart showing which generators are on or off each hour. Green bars mean the generator is running. Gray means it is off.
-
Cost Summary: Total production cost for the study period, broken down by fuel cost, startup costs, and any penalty costs.

Step 7: Explore a Specific Decision
Click on any generator in the commitment timeline to see why it was committed or left offline. The Decision Explanation panel shows the specific reason in plain language:
"Generator 107_CC_1 was committed at hour 14 because load exceeded available online capacity by 45 MW. Startup cost: $28,044. Without this unit, the system would have violated the spinning reserve requirement."
This is one of MangoGridStudio's core features: every decision has a traceable reason.
Step 8: Save and Share
Click Save to preserve your project. You can return to it later, compare it with other scenarios, or share it with colleagues.
To export results, click Export and choose your format: Excel spreadsheet, PDF summary report, or raw data (JSON/CSV).
Troubleshooting
"Import failed: validation errors"
Your data file has missing or invalid fields. Click the error message to see which fields need correction. Common issues: missing generator capacity values, negative costs, or transmission lines referencing buses that do not exist in the bus list.
"Solver returned INFEASIBLE"
The optimizer could not find a solution that satisfies all constraints simultaneously. This usually means demand exceeds total available generation capacity, or a transmission bottleneck prevents power from reaching where it is needed.
"Results look unreasonable"
Check your input data, especially fuel prices and generator costs. If fuel prices are entered in the wrong units (for example, dollars per million British Thermal Units instead of dollars per thousand British Thermal Units), the optimizer will produce valid but misleading results.